
Business Intelligence
Dashboards and shared definitions that leaders trust, in Power BI, Tableau or the tool you use.
MBE certified (Minority Business Enterprise)
Overview
About Business Intelligence
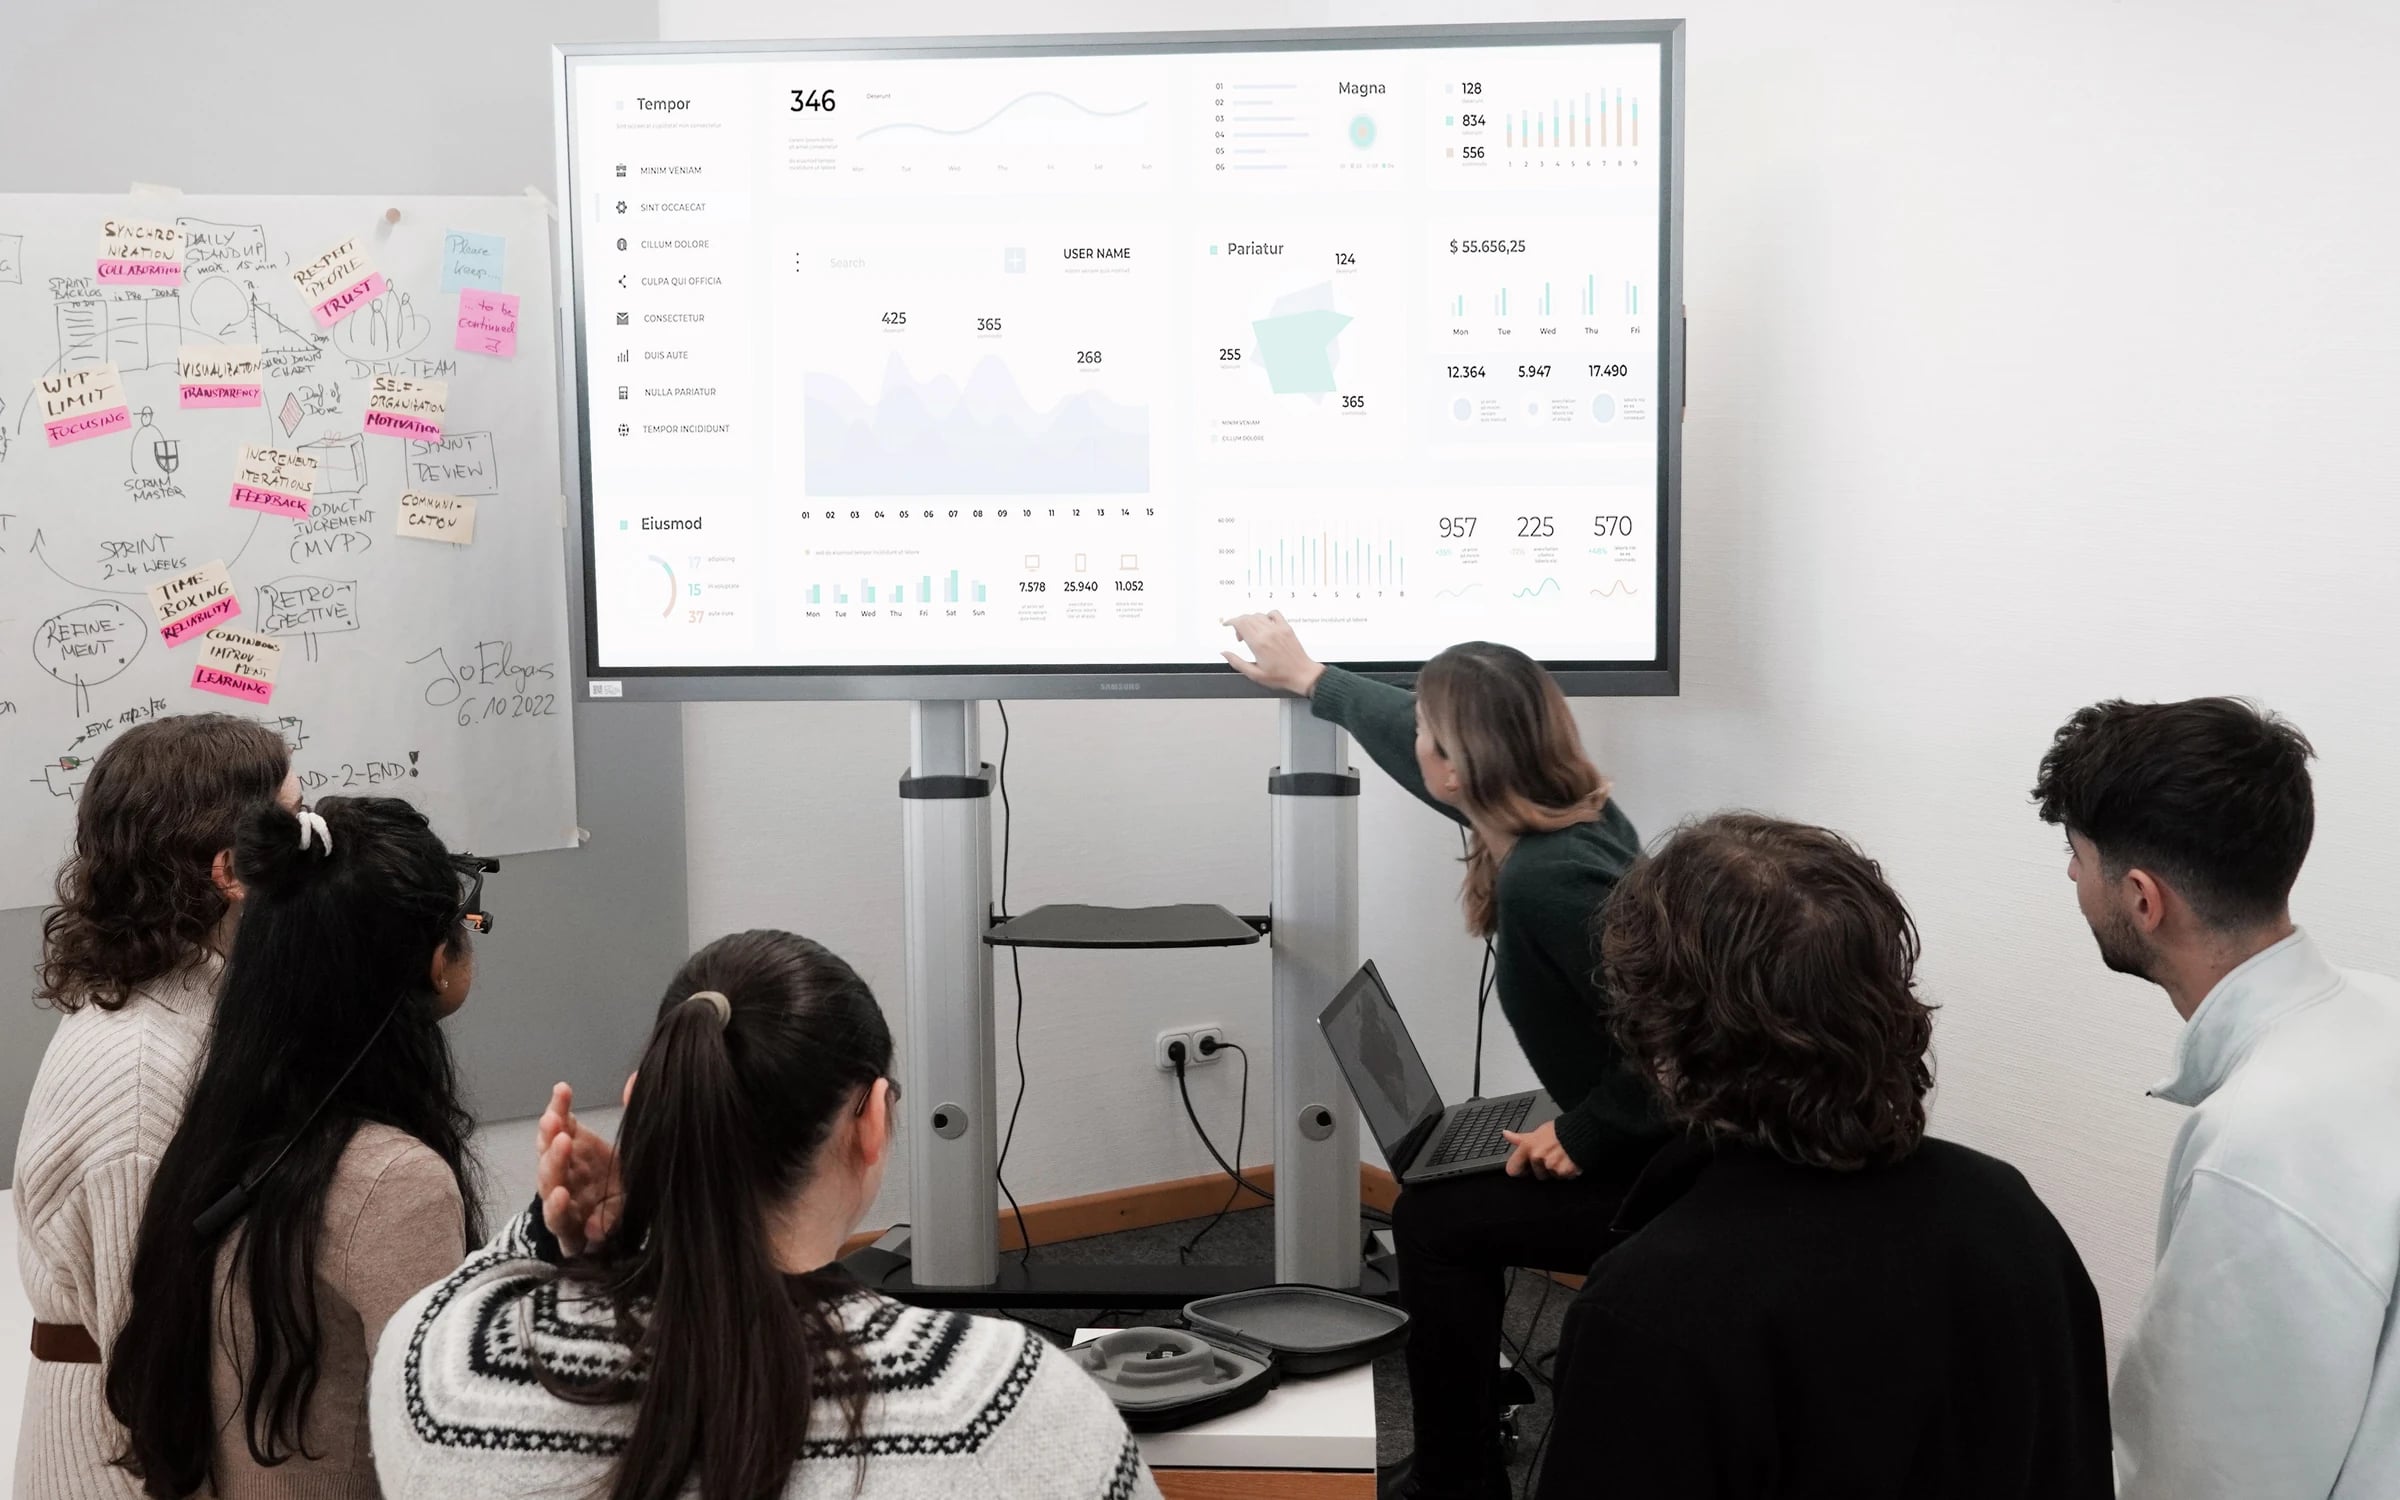
Business intelligence puts the right numbers in front of the people who decide. Desmata designs and builds dashboards, reports and data models that are accurate, quick to load and easy to read. We start with the decisions each audience makes, not with the data that happens to be available.
Behind every good dashboard is an agreed set of definitions. We work with finance, operations and sales to settle what counts as revenue, an active customer or a late order, and encode it once in a governed semantic layer.
We build on the BI tools you already own or help you choose one. Then we train your analysts, so new questions do not need a new project.
Start with a conversation
Tell us what you are working on. A member of the Desmata team will reply by email or phone.
Call us on +1 (214) 407-8089Outcomes
What you get
One version of each number
A shared semantic layer and documented metric definitions end the argument over whose spreadsheet is right.
Reports that load fast
Dimensional models and incremental refresh keep dashboards responsive as data volumes grow.
Earlier warning
Thresholds and alerts flag a change in performance while there is still time to respond.
Analysts who can self-serve
Training and governed datasets let your own people explore the data without waiting on IT.
Capabilities
What we do, in detail
Dashboard and report design
Visuals designed for the decision, not the data.
- Executive scorecards and operational dashboards
- Drill-down paths from summary to transaction
- Mobile and embedded views
- Accessible color and layout standards
Data modeling and semantic layer
A model that keeps meaning consistent across reports.
- Star-schema and dimensional modeling
- Governed metrics and calculation logic
- Row-level security by role or region
- Incremental refresh and performance tuning
Data integration for reporting
Source systems prepared for analysis.
- ELT with dbt into Snowflake, BigQuery, Redshift or Azure Synapse
- Connectors for ERP, CRM, HRIS and finance systems
- Data quality tests with alerts on failure
- Scheduled refresh and monitoring
BI platform migration
Move to a better tool without losing trusted reports.
- Inventory and rationalization of existing reports
- Rebuild in Power BI, Tableau or Looker
- Side-by-side validation of old and new numbers
- Retirement plan for duplicate reports
Enablement and governance
Habits that keep a BI program healthy.
- Role-based training for authors and viewers
- Workspace, naming and release standards
- Usage monitoring to retire unused reports
- Data dictionary and ownership map
Approach
How an engagement runs
Step 1: Identify the decisions
We interview the people who use the reports and list the decisions, the cadence and the numbers each one depends on.
Step 2: Agree the definitions
Metric definitions and owners are written down and signed off before any visual is built.
Step 3: Model and build
We build the data model and the first dashboards together and review them with real users each iteration.
Step 4: Validate
Figures are reconciled to source systems and to the reports finance already trusts.
Step 5: Train and release
Users are trained, support routes are set, and the old reports are retired on an agreed date.
Technologies and standards
What we work with
Tools, platforms, frameworks and standards our teams work with and design for. Standards are context for the work, not certifications held by Desmata.
BI platforms
- Microsoft Power BI
- Tableau
- Looker
- Qlik Sense
- Apache Superset
Warehouses
- Snowflake
- Google BigQuery
- Amazon Redshift
- Azure Synapse
- SQL Server
Modeling and pipelines
- dbt
- Apache Airflow
- Azure Data Factory
- Fivetran
Languages
- SQL
- DAX
- Python
- LookML
Engagement models
Ways to work with us
Dashboard project
A defined set of dashboards and the model beneath them, built and handed over.
BI platform migration
A planned move from one tool to another, with validation of every migrated report.
Embedded BI team
Developers and analysts who work your reporting backlog alongside your business teams.
Staff augmentation
BI developers or analysts added to a team you manage.
Technology and talent
Technology and talent together
BI skills are in steady demand. We place reporting and analytics professionals on contract, contract-to-hire or direct hire, and can pair them with our own modelers when a project needs both.
Roles we can also staff
- Power BI developer
- Tableau developer
- BI architect
- Analytics engineer (dbt)
- Data analyst
- Data modeler
- Report developer
- ETL developer
Need the people as well as the plan?
The engineers who design the work and the specialists who join your team come from one firm.
Why Desmata
Why Desmata
Your tool, your definitions
We do not push a favorite platform. We build on what fits your licenses, skills and sources, and encode your own business rules.
Delivery and hiring together
If your BI program needs a permanent report developer, the same firm can build the first release and find the hire.
Measured by use
We track adoption and refresh reliability, so success means decisions being made from the dashboards.
Questions
Frequently asked questions
Power BI or Tableau, which should we choose?
It depends on your existing licenses, your data platform and the people who will build reports. Power BI often fits Microsoft-centered organizations, while Tableau is strong for visual exploration. We will compare both against your needs before you commit.
Can you clean up reports that nobody trusts?
Yes. We inventory the reports, trace each figure to its source, and rebuild the ones that matter on a governed model. Duplicates and unused reports are retired on an agreed schedule.
Do you build dashboards on real-time data?
We can, using streaming pipelines or frequent incremental refresh. Many dashboards are better on scheduled refresh, which is cheaper to run, and we recommend by decision need.
Will our team be able to maintain the dashboards?
That is the goal. We document the model, train your authors, and set naming and release standards so changes remain consistent after we leave.
Make your numbers easier to trust
Tell us which reports leaders rely on and what frustrates them. We will suggest what to fix first and the skills required.
MBE certified (Minority Business Enterprise)